
The HTML document request is the starting point for any page load process in the browser. Find out how poor document latency impacts website speed and what you can do to improve it.
What is the new document request latency insights audit?
Google is adding new insights audits to Lighthouse and PageSpeed Insights.
Each audit checks one aspect of your overall website performance and looks at different ways it could be improved.
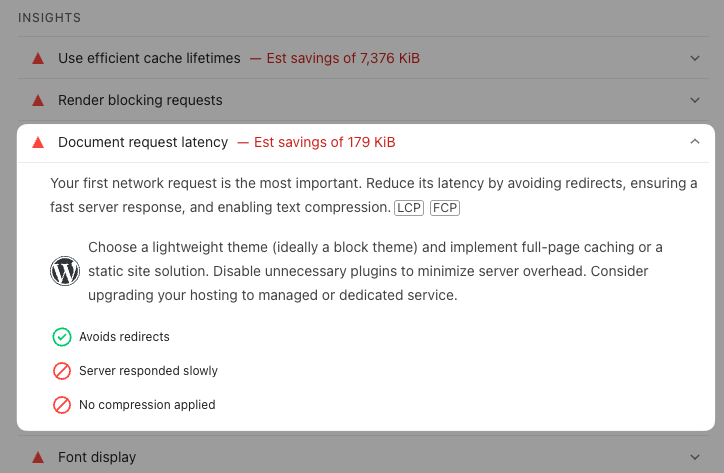
Document request latency measures how long it takes to load the HTML document on the page. The HTML document is the first resources loaded when opening a website.
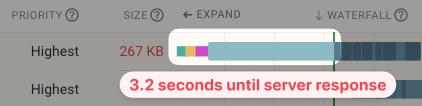
There are two components to loading the HTML document:
- Time to First Byte: how soon the first response byte arrives in the browser
- Response download time: how long it takes to download the HTML code (which depends on the size of the HTML document)
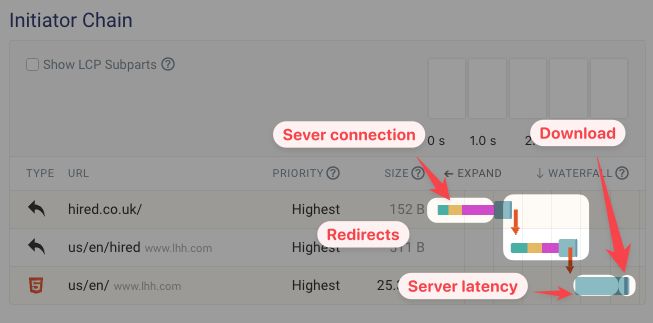
A network request waterfall lets you view the different components of loading the HTML request.
How to fix issues causing document request latency
There are a number of different ways to reduce HTML document request latency. Let's take a look at some of the most common issues.
Server responded slowly
Generating the HTML document can be fast or slow, depending on how much work there is to do and how powerful your server is. Producing the HTML code may require complex rendering logic, database queries, and third-party API calls.
If you face this issue on your website there are a several ways to reduce initial sever response time, for example:
- Upgrade your hosting infrastructure
- Optimize database queries
- Speed up backend rendering code
- Setting up response caching on a CDN
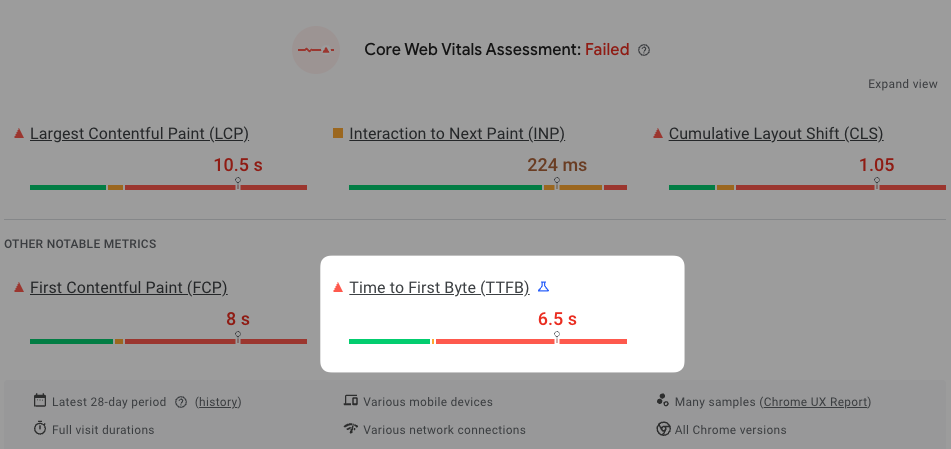
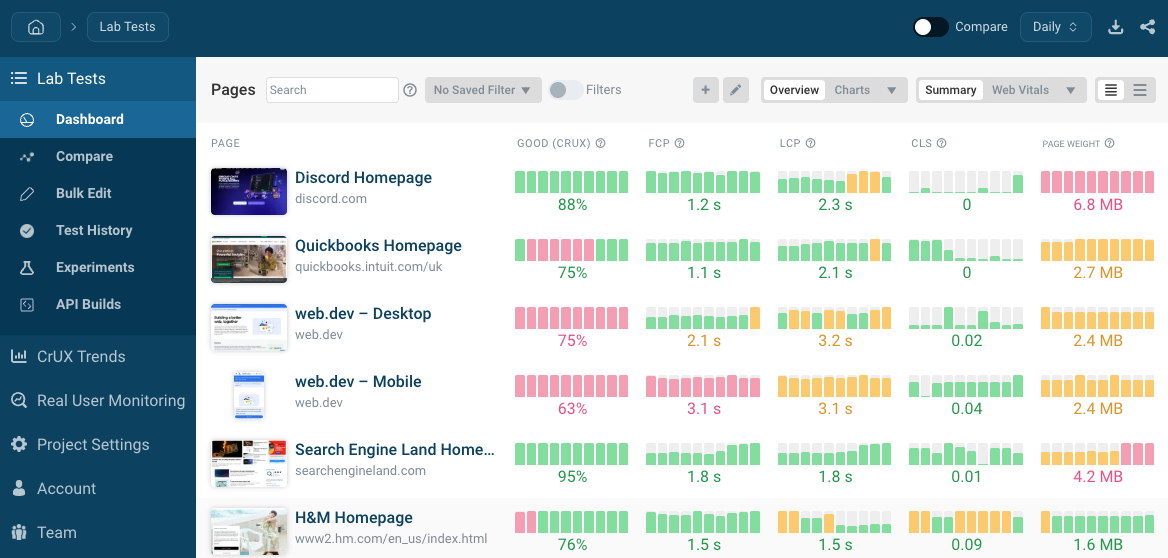
Check if real users experience the same TTFB wait times as shown in the lab result. Sometimes you may see differences, for example if many visitors are logged in or if synthetic tests are more likely to hit a server-side cache.
To view real user data you can look at Google's Chrome User Experience Report (CrUX) data or set up real user monitoring.
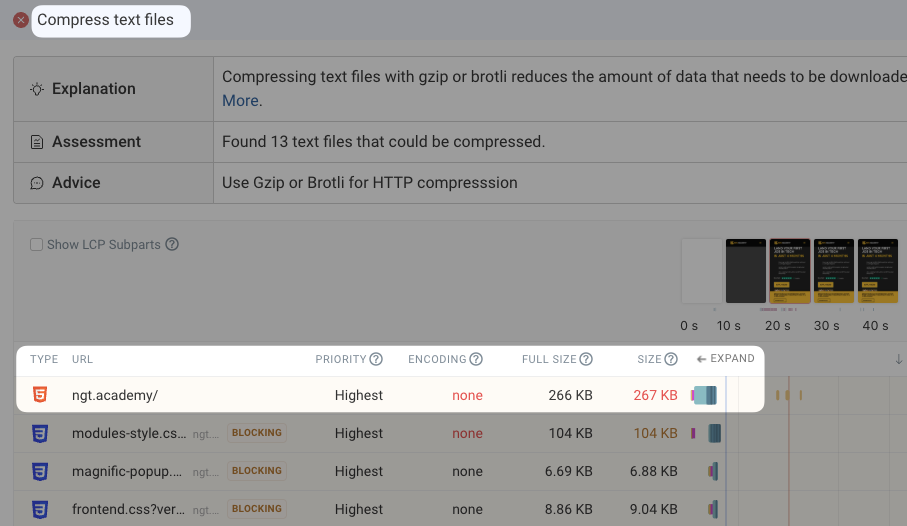
No compression applied
HTTP text compression is a way to reduce HTML size without making any changes to the code itself. Instead, compression algorithms like Gzip or Brotli are used to reduce the amount of data transferred between the server and the browser.
If you run DebugBear's free website speed test you can see more details about text compression on your website. Ideally the full size is larger than the transferred size and the content encoding column should show what compression algorithm was used.
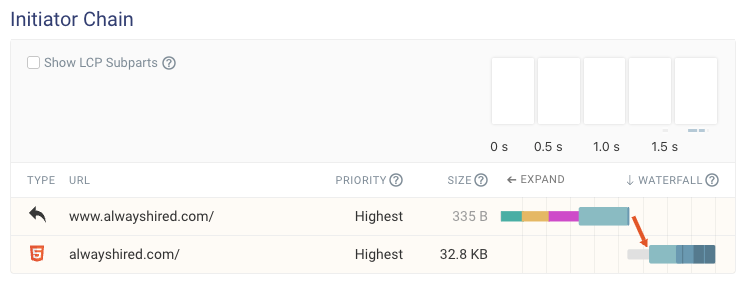
Avoid redirects
Ideally visitors should arrive directly on the URL they're trying to access. However, sometimes content has moved or the visitor is redirected to a page in their language or for their local country. These page redirects impact load time, as the browser spends time making requests only to then be sent elsewhere.
To fix this you can update old links on your website and avoid redirect chains by sending visitors to the final destination URL right away.
Reduce HTML document size
There are many ways to reduce HTML file size by actually sending less code. To see what's taking up space in your HTML document you can use the HTML Size Analyzer tool.
For example, on this website the New Relic script embed takes up 58 kilobytes of the HTML embed. Base64 images in the HTML code are also a common performance problem.
Stay on top of your website performance
Document request latency is just one part of improving overall website performance. Ultimately, the rest of the content also needs to load quickly for users so that your website can get a good Largest Contentful Paint score. And there are other Core Web Vitals metrics with ranking impact as well!
DebugBear is a comprehensive page speed and Core Web Vitals monitoring tool. You can run scheduled synthetic performance tests with in-depth reporting, monitor Google CrUX data, and measure real users page load time as well as slow interactions.


Monitor Page Speed & Core Web Vitals
DebugBear monitoring includes:
- In-depth Page Speed Reports
- Automated Recommendations
- Real User Analytics Data