Real User Error Monitoring
DebugBear RUM lets you track JavaScript errors your visitors encounter on your website.
Enable error monitoring
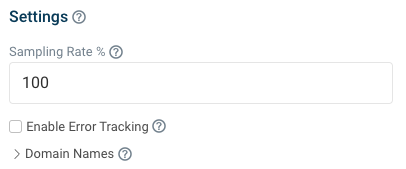
Error monitoring is disabled by default for RUM snippets that have been set up after late October 2024.
If you have an older RUM snippet you need to click Enable error tracking in the RUM Configuration tab and update the embed code on your website.
What error messages are tracked on the page?
DebugBear RUM error monitoring reports two types of page errors:
- JavaScript exceptions
- Unhandled promise rejections
The following errors from the browser DevTools console won't be reported in RUM:
- Console messages like
console.errorcalls - SVG parser errors
- Failed network requests
RUM error monitoring dashboard
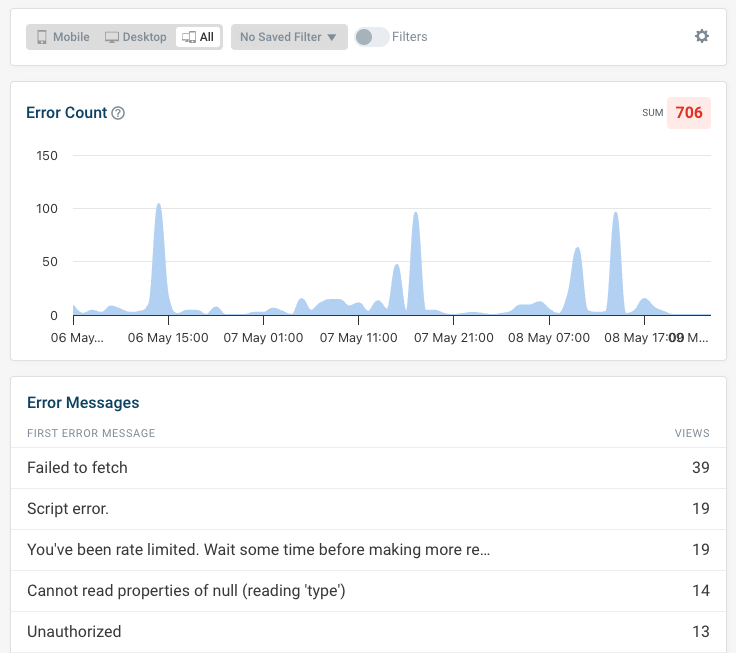
You can find the error dashboard by clicking on Errors in the sidebar when viewing your RUM data. It will show the total number of errors reported over time.
Viewing common error messages and locations
Error monitoring includes the following three fields on each page view:
- First Error Message
- First Error Script URL
- First Error Function Name
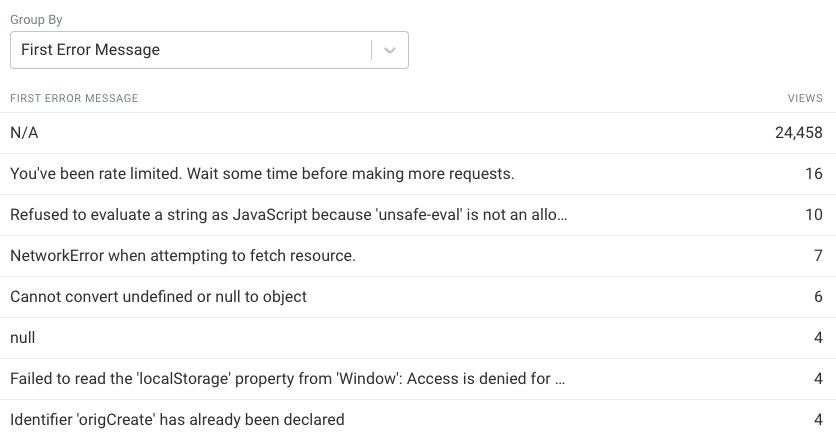
When viewing aggregated data only the first error that occurred on the page is considered, even if multiple errors occurred on the page.
You can open the Table view and group by error message to see common errors on your website.
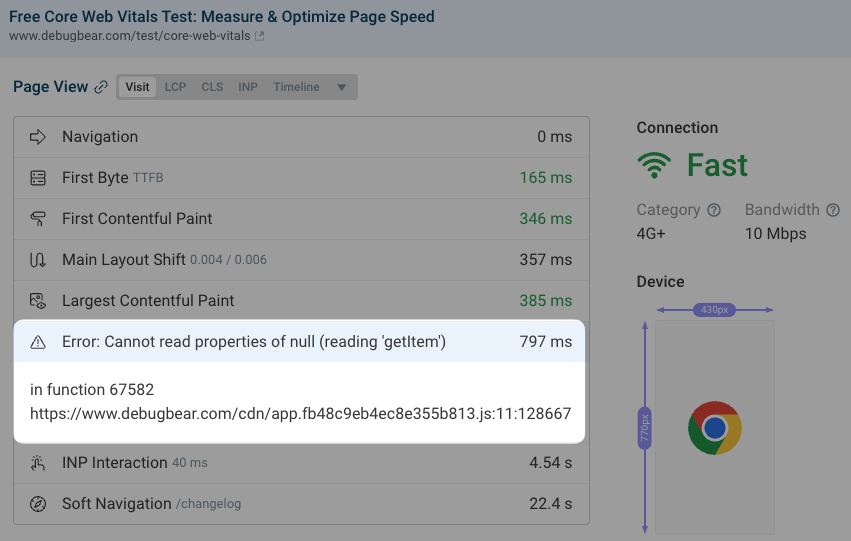
Viewing errors on a specific page view
When viewing specific page views you can see when errors occurred in the Timeline tab. Up to three errors are recorded.
In addition to the error message, script URL, and function name, you can also see a line and column number.